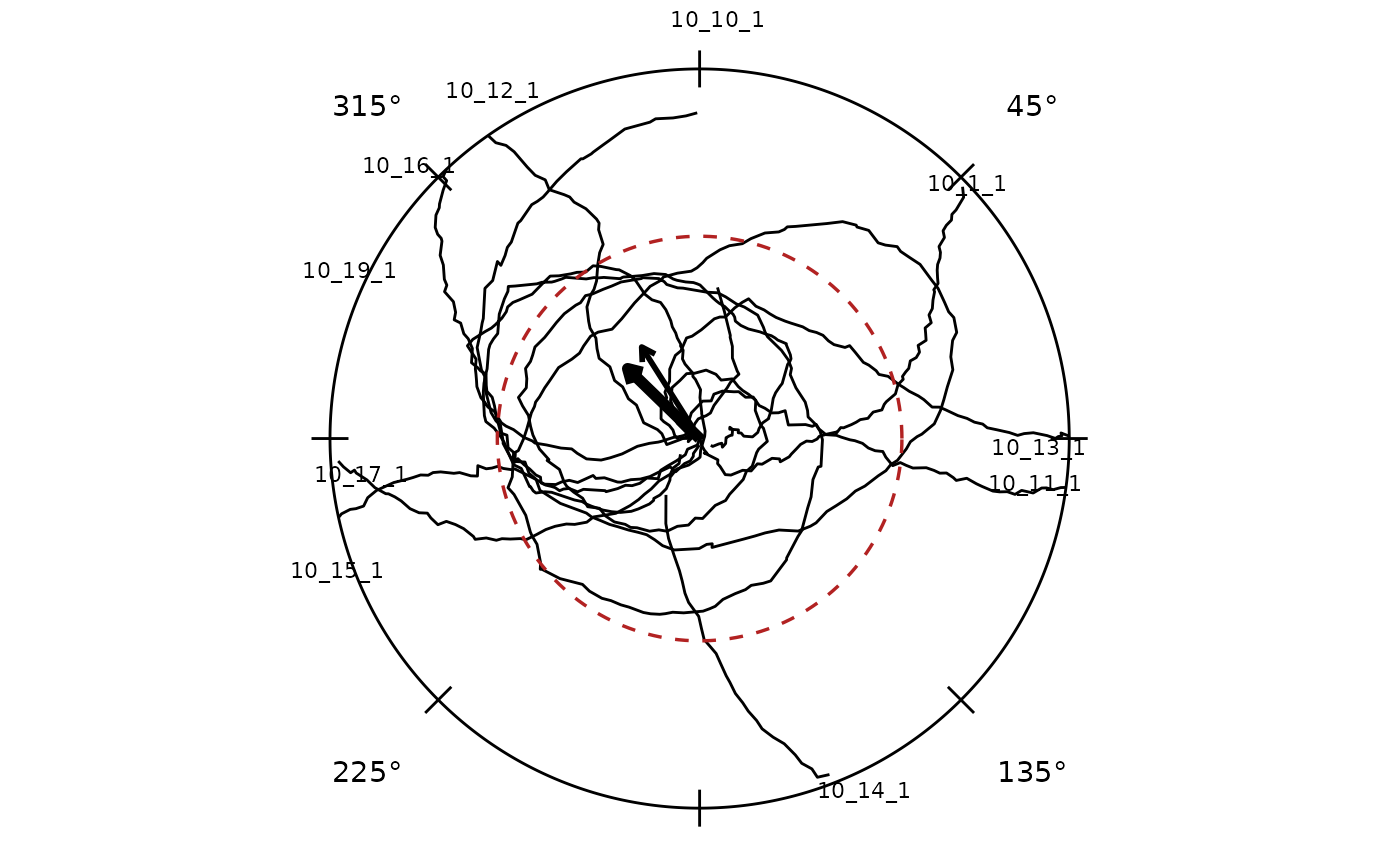
Add a critical resultant-length circle to a radiate plot
Source:R/circular_plotting.R
add_critical_r.RdDraws an inner reference circle at the critical mean resultant length
– the smallest \(\bar R\) at which a circular significance test reaches
alpha for the given sample size. If a group's mean-direction arrow
(add_heading_arrow) extends beyond this circle, that group's
headings are significantly directed at the alpha level. This is the
convention used by Oriana and similar circular-statistics software.
Usage
add_critical_r(
  hd,
  alpha = 0.05,
  test = c("rayleigh", "vtest"),
  angle_col = "heading",
  facets = NULL,
  group_col = NULL,
  colour = "firebrick",
  linetype = "dashed",
  linewidth = 0.6,
  n_pts = 200L
)
Arguments
- hd
Data frame of headings with a heading column (radians).
- alpha
Significance level. Default
0.05.- test
"rayleigh"(default) or"vtest".- angle_col
Heading column name. Default
"heading".- facets
Character vector of column names that define the facet panels (placement only). The critical radius is computed per facet cell and every one of these columns is attached to the layer data so the circles land in the right panel under facet_wrap()/facet_grid().
NULLpools all rows.- group_col
Optional single column. Splits each cell into subgroups (one circle each) and maps the circle colour to that column.
NULLdraws every circle in the fixedcolour.- colour
Circle colour. Default
"firebrick". Overridden by the colour scale whengroup_colis set.- linetype
Line type. Default
"dashed".- linewidth
Line width. Default
0.6.- n_pts
Points used to approximate each circle. Default
200L.
Details
Two tests are supported:
"rayleigh"(default)Tests against uniformity with no hypothesised direction. Critical value \(\bar R_{crit} = \sqrt{-\log(\alpha) / n}\) (asymptotic; accurate for \(n \ge 10\)).
"vtest"Tests against a specific direction. Critical value \(\bar R_{crit} = z_\alpha / \sqrt{2n}\) at its most powerful (when the observed mean direction equals the hypothesised \(\mu_0\)); the effective threshold rises as the observed direction departs from \(\mu_0\), so this circle is a lower bound.
Sample size n is taken per occupied cell from hd. Pass the
same column(s) to facets as you pass to radiate(rows=)/radiate(cols=)
so one circle is drawn per panel at the radius appropriate to that panel's
n. Pass group_col to split each cell further by colour.
Examples
hd <- derive_headings(cpunctatus[1:10], rule = "distal")
radiate(cpunctatus[1:10]) +
  add_heading_arrow(hd) +
  add_critical_r(hd)
#> Warning: Removed 5 rows containing missing values or values outside the scale range
#> (`geom_path()`).