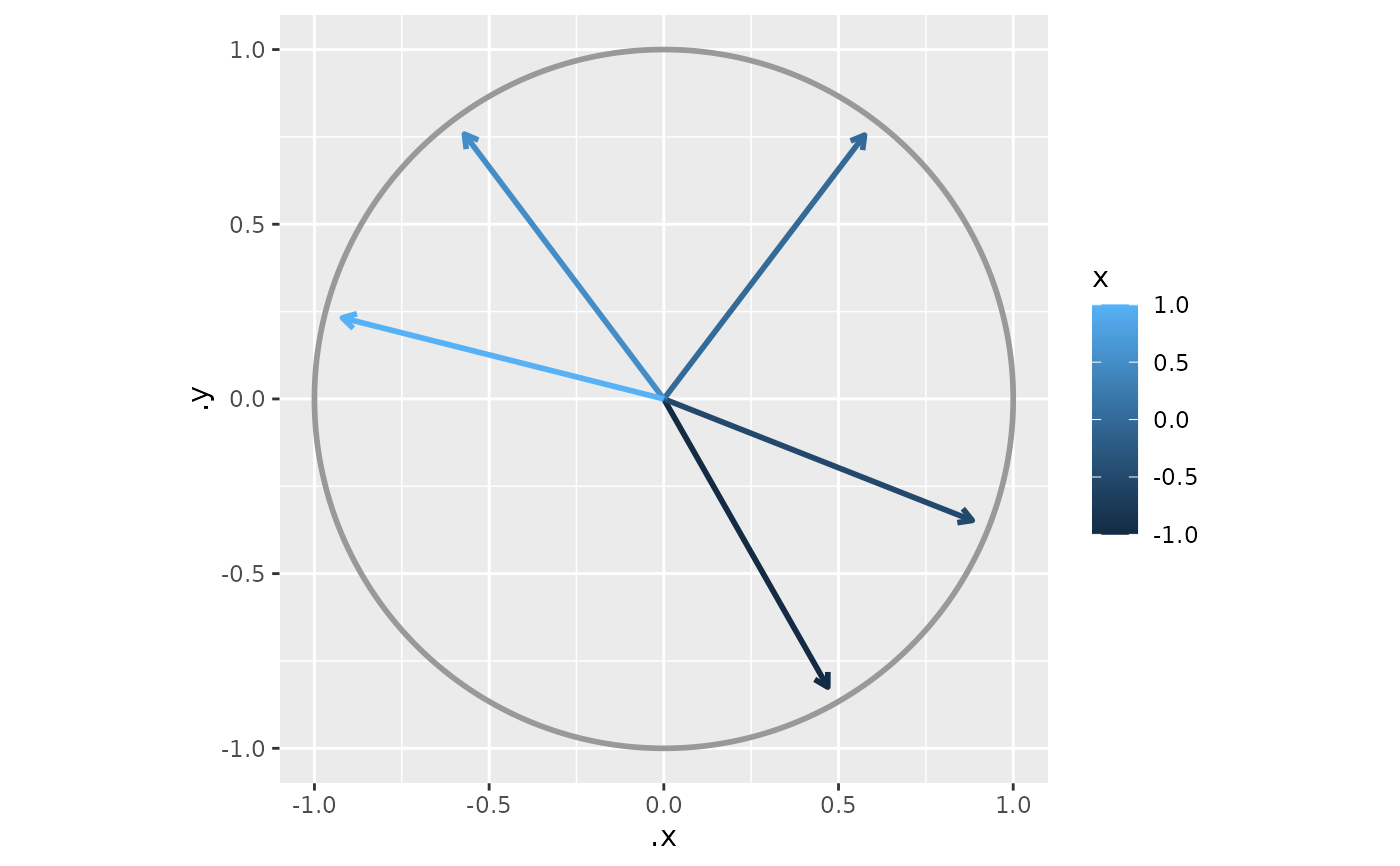
Fitted mean directions from a circular regression, for plotting
Source:R/circular_regression.R
fitted_directions.RdShapes the predictions of a [circ_regression()] model into the `summary_df`
that [add_circ_mean()] draws, so a fitted mean-direction (rho) arrow can be
drawn for each covariate value and colour-coded by the covariate – showing
how the mean heading sweeps with the predictor. The arrow length is the
model's implied resultant length circular::A1(kappa), the same for
every arrow, so direction and colour carry the signal.
Arguments
- fit
A `circ_regression` object.
- at
Numeric (or factor) values for the model's single right-hand-side variable – a convenience for one-predictor models. Supply exactly one of `at` or `newdata`.
- newdata
A data frame of covariate values, one row per arrow (for multi-predictor models, or full control). Supply exactly one of `at`/`newdata`.
- display
A [circ_display()] object stored on the result so the arrows orient with the panel. Default [circ_display()].
Value
A data frame with `mean_dir` (fitted heading, radians, unit-circle convention), `resultant_R` (= `circular::A1(fit$kappa)`, constant), and the covariate column(s) from `newdata`, with a `display` attribute. Pass it to `add_circ_mean(colour_col = "<predictor>")`. A non-converged fit yields `NA` `mean_dir` rows, which `add_circ_mean()` skips.
Examples
set.seed(1)
x <- runif(60, -1, 1)
noise <- as.numeric(circular::rvonmises(60, circular::circular(0), kappa = 8))
hd <- data.frame(x = x, heading = (1 + 2 * atan(1.5 * x) + noise) %% (2 * pi))
fit <- circ_regression(hd, heading ~ x)
arrows <- fitted_directions(fit, at = c(-1, -0.5, 0, 0.5, 1))
arrows
#>   mean_dir resultant_R    x
#> 1 5.229655   0.9487831 -1.0
#> 2 5.907878   0.9487831 -0.5
#> 3 0.920445   0.9487831  0.0
#> 4 2.216197   0.9487831  0.5
#> 5 2.894420   0.9487831  1.0
library(ggplot2)
ggplot() +
  coord_fixed() +
  add_circ() +
  add_circ_mean(arrows, colour_col = "x")