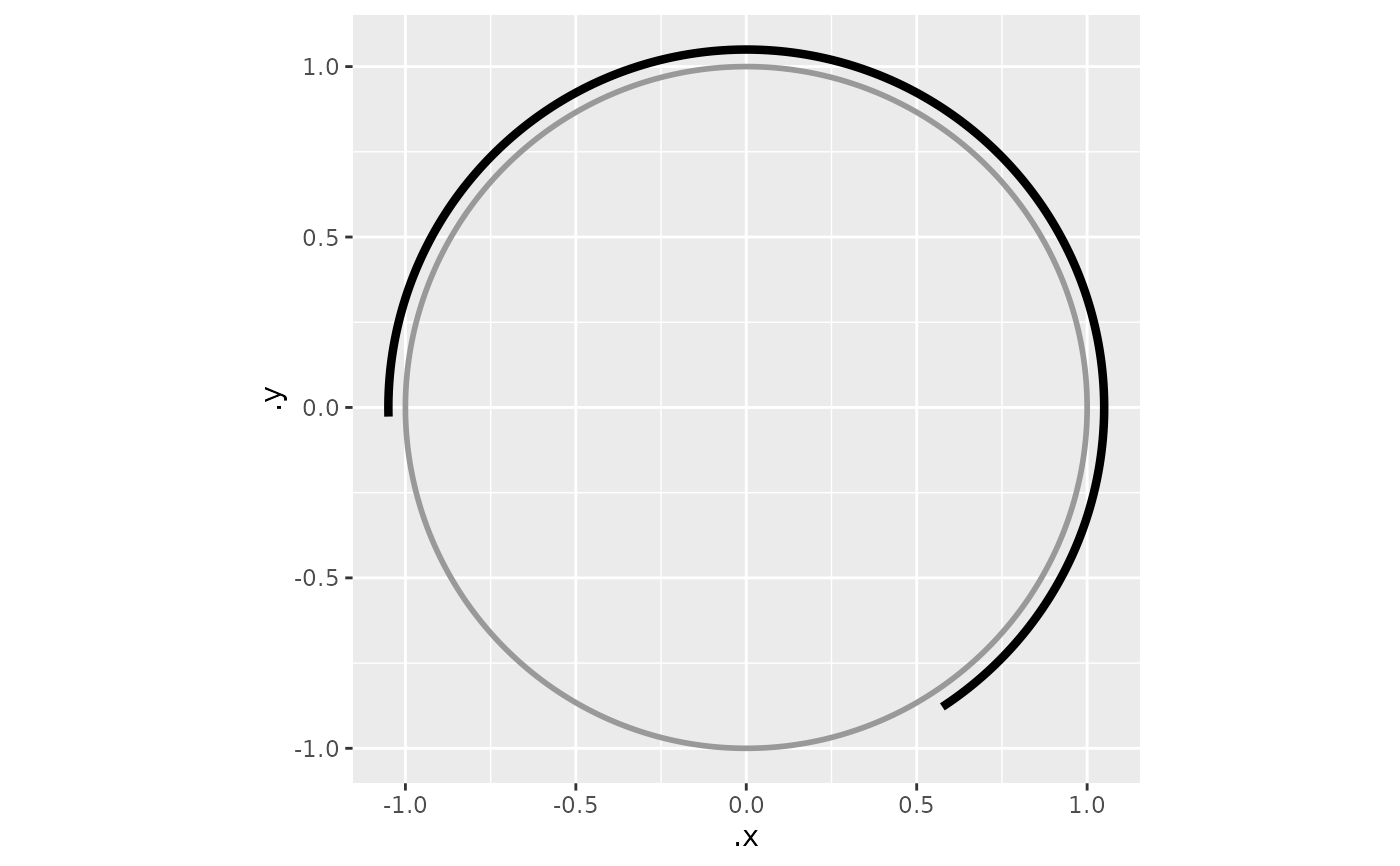
Compute a circular interval arc and add it to a radial plot in one step
Source:R/circular_plotting.R
add_heading_interval.RdConvenience wrapper that calls [compute_circ_interval()] followed by [add_circ_interval()]. Use [compute_circ_interval()] + [add_circ_interval()] directly when you need to replace `lower`/`upper` with Bayesian credible interval bounds before rendering.
Usage
add_heading_interval(
  headings_df,
  heading_col = "heading",
  facets = NULL,
  group_col = NULL,
  display = NULL,
  stat = c("bootstrap_ci", "sd"),
  boot_reps = 1000L,
  boot_alpha = 0.05,
  radius = 1.05,
  linewidth = 1.5,
  colour = NULL,
  linetype = "solid",
  n_theta = 500L,
  axial = FALSE,
  color = NULL
)
Arguments
- headings_df
Data frame containing heading angles.
- heading_col
Name of the heading column (radians). Default `"heading"`.
- facets
Character vector of column names used for faceting (placement). Passed to [compute_circ_interval()]; each column is attached to the layer data so `facet_grid()`/`facet_wrap()` can place the arc correctly. Default `NULL`.
- group_col
Single column name used for colour grouping. Passed to [compute_circ_interval()] and then to [add_circ_interval()] as `colour_col`. Default `NULL`.
- display
A [`circ_display`] object. When `NULL` (default), read from `attr(headings_df, "display")`, falling back to `circ_display()`.
- stat
Statistic: `"bootstrap_ci"` (default) or `"sd"`.
- boot_reps
Integer. Bootstrap replicates for `stat = "bootstrap_ci"`. Default `1000L`. Ignored when `stat = "sd"`.
- boot_alpha
Significance level for the bootstrap CI. Default `0.05` produces a 95% interval.
- radius
Radial position of the arc. Default `1.05`.
- linewidth
Line width. Default `1.5`.
- colour, color
Fixed colour. When `NULL` (default) and `colour_col` is set, colour is mapped from that column; when `NULL` and no `colour_col`, draws in `"black"`. Supplying any colour string always overrides `colour_col`. `color` is the American-spelling alias.
- linetype
Line type. Default `"solid"`.
- n_theta
Number of points along the arc. Default `500L`.
- axial
Logical. Render the overlay for axial (bidirectional, mod-pi) data via the angle-doubling method: the CI is drawn at both poles of the axis. Default `FALSE`.
Examples
hd <- derive_headings(cpunctatus[1:5], rule = "distal")
library(ggplot2)
ggplot() +
  coord_fixed() +
  add_circ() +
  add_heading_interval(hd, stat = "sd")