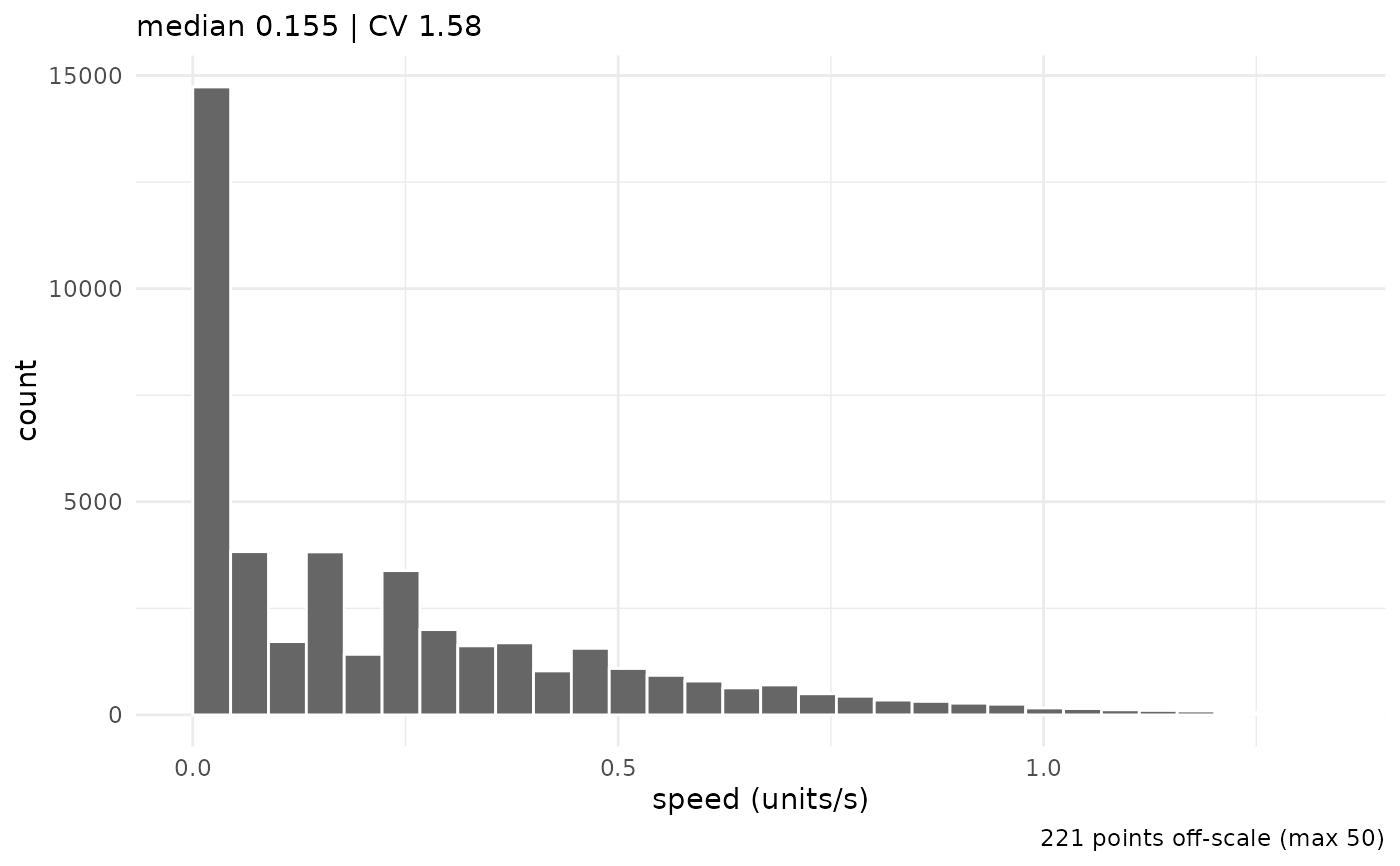
A pooled histogram of step speeds ([instantaneous_speed()]) across all tracks, annotated with the pooled median and coefficient of variation (CV = sd / mean, a movement-regularity descriptor). The companion distribution view to the time/scatter plots of [plot_profile()] / [plot_speed_direction()].
Details
The speed axis is robustly clipped by default (`max_speed = NULL` zooms to the 99.5 bulk of the distribution; a caption reports how many steps are off-scale. The clip is a view zoom (`coord_cartesian`), so no data are dropped. Set `max_speed` to a number for a hard cap, or `Inf` for the full raw range.
Examples
ts <- set_frame_rate(cpunctatus, 30)
plot_speed_histogram(ts)