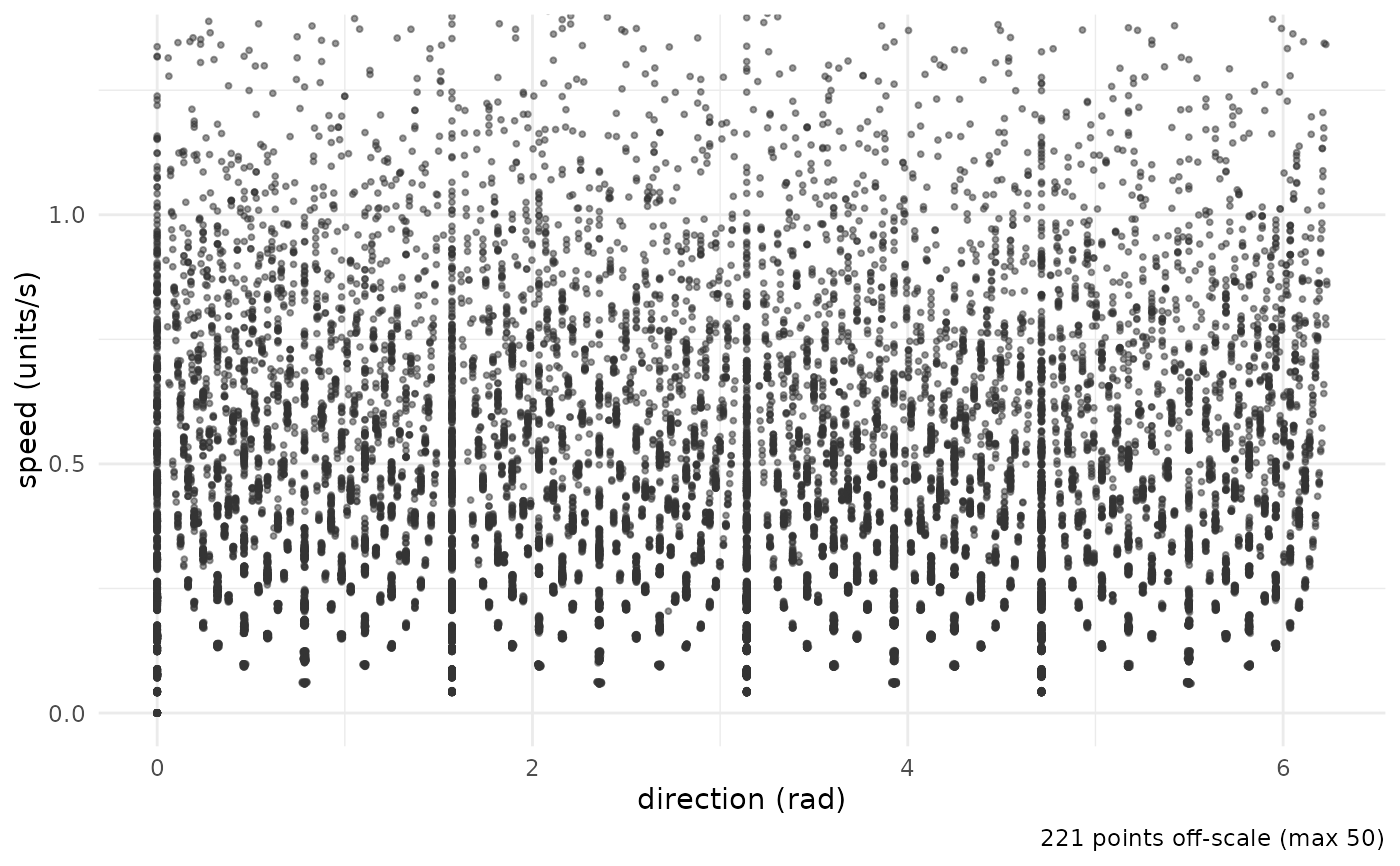
Plots each observation's instantaneous speed ([instantaneous_speed()]) against its movement direction ([velocity_angle()]) – the bivariate companion to the time profiles of [plot_profile()]. Points, since direction is circular.
Usage
plot_speed_direction(
  ts,
  units = c("radians", "degrees"),
  colour_by = NULL,
  max_speed = NULL
)
Arguments
- ts
A `Tracks`. Needs a frame rate for frame-indexed time ([set_frame_rate()]); POSIXct time is used directly.
- units
Direction units: `"radians"` (default, `[0, 2*pi)`) or `"degrees"` (`[0, 360)`).
- colour_by
Optional column of `as.data.frame(ts)` to colour points by.
- max_speed
Speed-axis cap: `NULL` (default, 99.5 number (hard cap), or `Inf` (no clip).
Details
The speed axis is robustly clipped by default (`max_speed = NULL` zooms to the 99.5 display; a caption reports how many points are off-scale. The clip is a view zoom (`coord_cartesian`), so no data are dropped. Set `max_speed` to a number for a hard cap, or `Inf` for the full raw range.
Examples
ts <- set_frame_rate(cpunctatus, 30)
plot_speed_direction(ts)