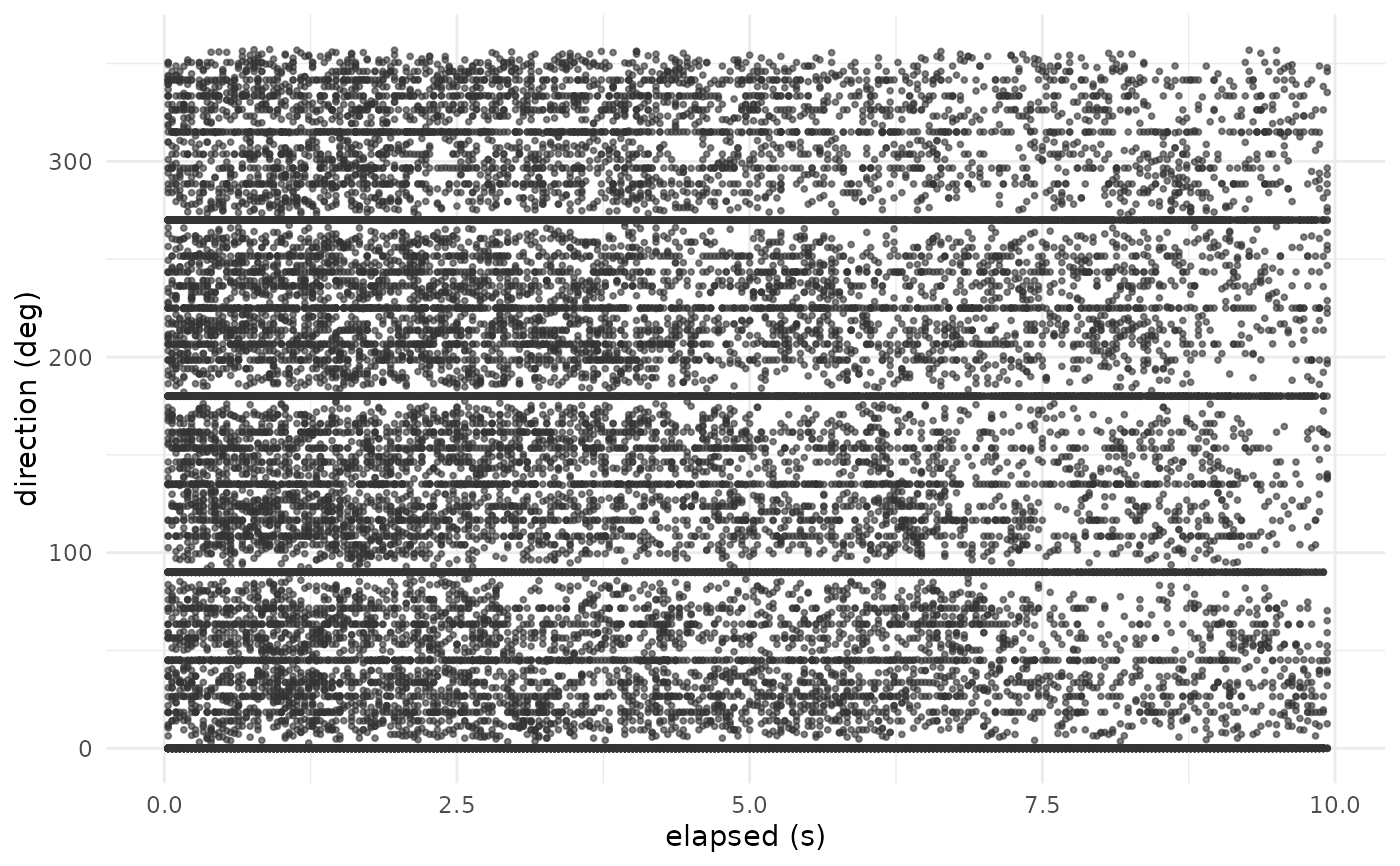
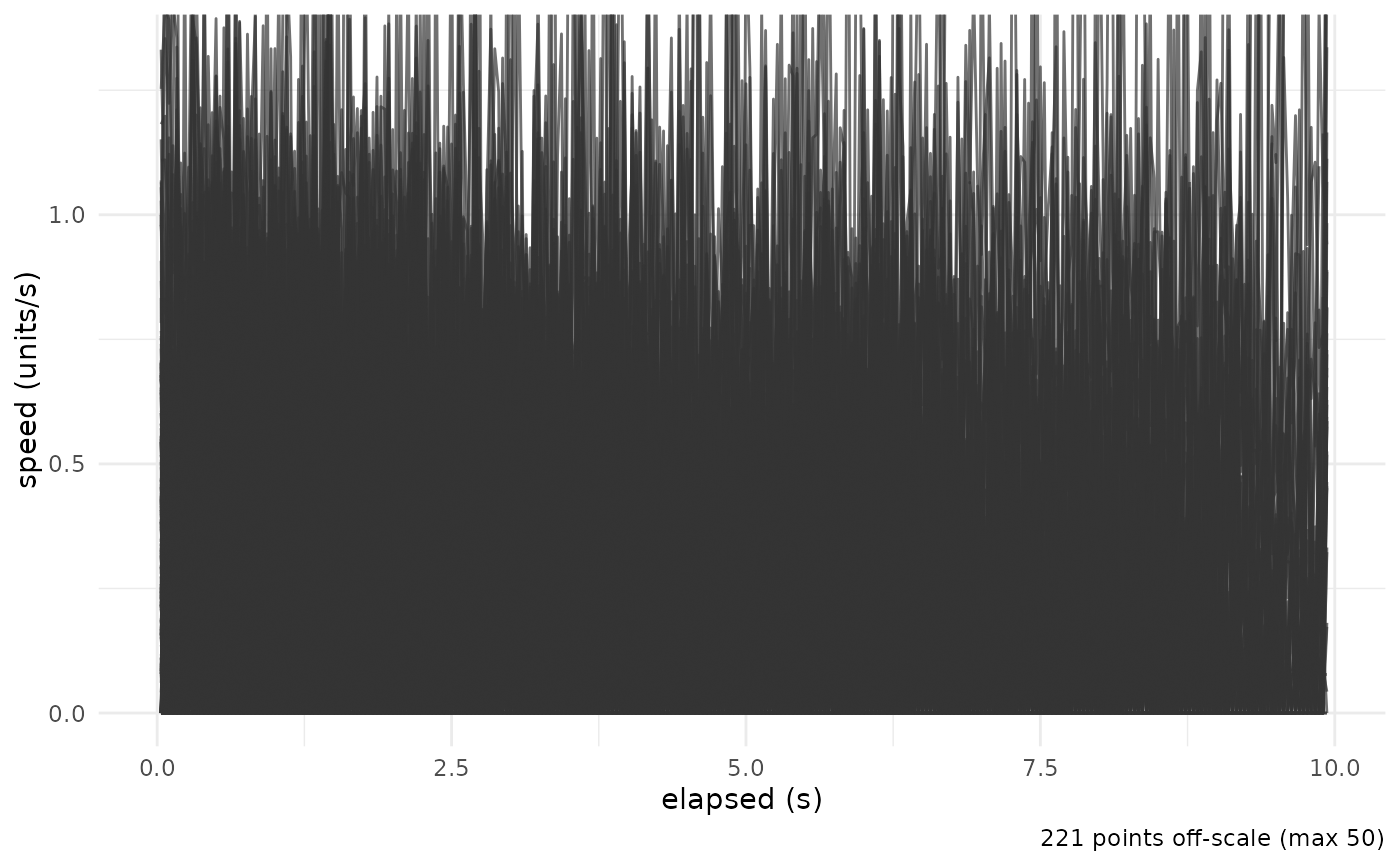
Draws a per-observation kinematics metric against elapsed time – the non-circular companion to [radiate()]. `metric = "speed"` plots [instantaneous_speed()] (one line per track); `metric = "turning"` plots [angular_velocity()] (one line per track); `metric = "direction"` plots [velocity_angle()] (the movement direction) as points.
Arguments
- ts
A `Tracks`.
- metric
`"speed"` (default), `"turning"`, or `"direction"`.
- units
For `metric = "turning"` (per second) or `metric = "direction"`, `"radians"` (default) or `"degrees"`.
- colour_by, facets
Optional column names of `as.data.frame(ts)` to colour by / facet into panels. Default: one neutral series per track.
- max_speed
For `metric = "speed"`, the speed-axis cap: `NULL` (default, the 99.5 plot), a positive number (hard cap), or `Inf` (no clip). Off-scale points are reported in a caption. Ignored for `"turning"`/`"direction"`.
- smooth
Integer window, in observations, for a centered per-track moving average of the `"speed"`/`"turning"` series. `1` (default) leaves the raw series unchanged; larger values smooth out per-frame jitter. Ignored for `"direction"` (a circular metric).
- show_raw
Logical; when `TRUE` and `smooth > 1`, draw the raw series as a faint line beneath the smoothed line. Default `FALSE`.
Details
Speed and turning rate are per-second, so a frame rate is required for frame-indexed time ([set_frame_rate()]); POSIXct time is used directly. With a distance calibration ([set_distance_scale()]) speed is in physical units. The speed axis is robustly clipped by default (see `max_speed`).
Direction is circular: it is drawn as points (not a line) because a line would draw a false vertical bar across the 0/2*pi seam. A rotating track shows points spread across the range, and values near 0/2*pi (0/360 degrees) appear at both extremes – the honest representation.
See also
[instantaneous_speed()], [angular_velocity()], [velocity_angle()], [plot_speed_direction()], [elapsed_seconds()], [radiate()], [set_frame_rate()]
Examples
ts <- set_frame_rate(cpunctatus, 30)
plot_profile(ts, metric = "speed")
 plot_profile(ts, metric = "direction", units = "degrees")