Label the circumference of a radial plot in domain units
Source:R/circumference_labs.R
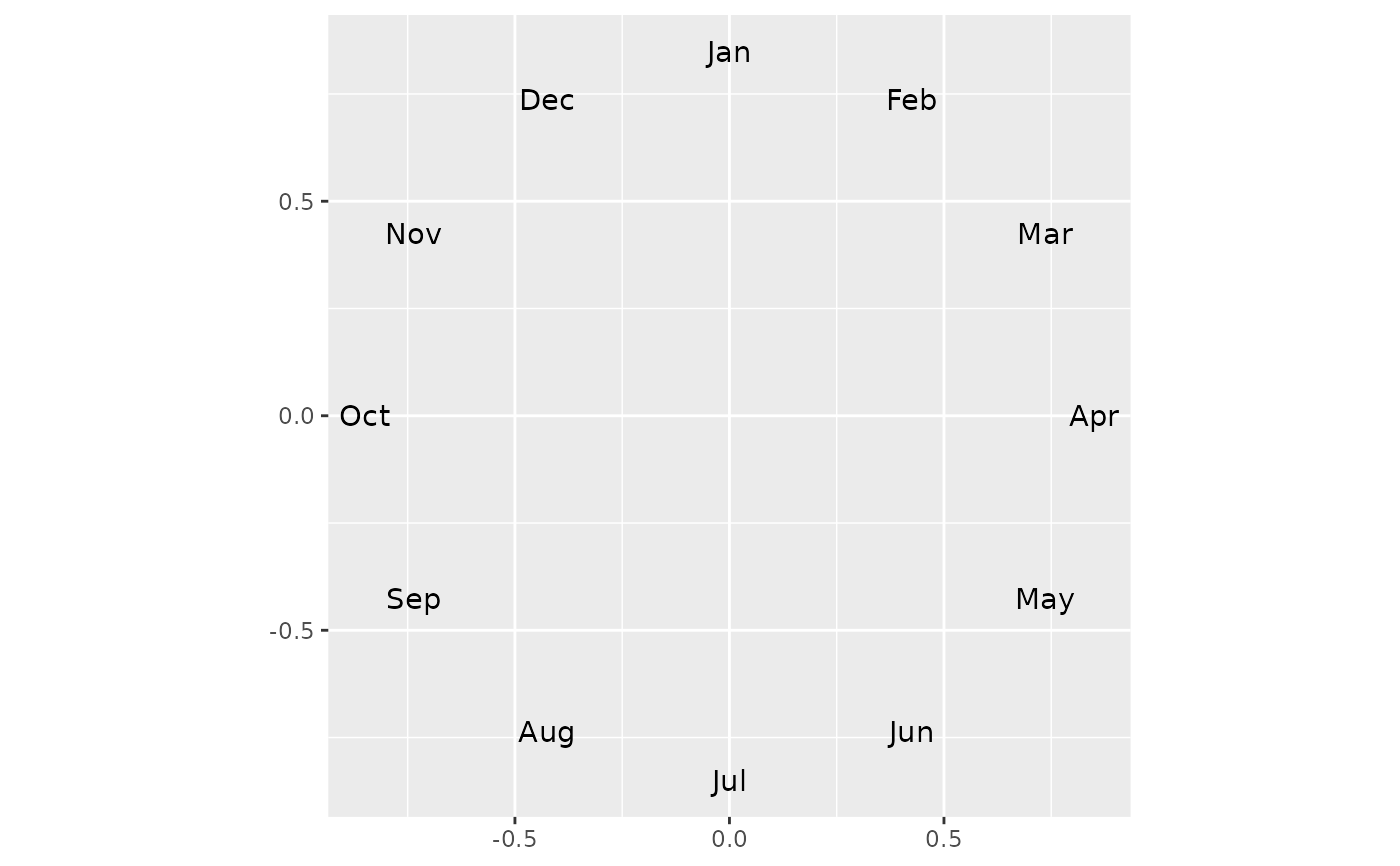
circumference_labs.RdAdds circumference text labels (cardinal directions, hours, months, seconds, or a custom scale) to a radial ggplot. The display-aware sibling of [degree_labs()]: labels are positioned through the supplied `display` so they track the plotted data when the convention changes.
Usage
circumference_labs(
  scale,
  display = circ_display(),
  colour = "black",
  size = 3.88,
  family = "",
  radius = 0.85,
  color = NULL
)
Arguments
- scale
A circumference-scale list, from [scale_cardinal()], [scale_clock()], [scale_months()], [scale_seconds()], or hand-written as `list(n =, at =, labels =)` (`at` in raw unit-circle radians, 0 = East, counterclockwise; `labels` the same length as `at`).
- display
A [circ_display()] convention. Default `circ_display()` (North/top, clockwise).
- colour, color
Label colour. Default `"black"`. `color` is the American-spelling alias.
- size
Label text size, in mm. Default `3.88` (ggplot2's default).
- family
Label font family. Default `""` (device default).
- radius
Radial distance of the labels from the centre, as a multiple of the unit circle. Default `0.85`.
See also
[degree_labs()] for degree/radian labels; [scale_cardinal()], [scale_clock()], [scale_months()], [scale_seconds()].
Examples
library(ggplot2)
ggplot() +
  coord_fixed() +
  circumference_labs(scale_months())