Add heading vector segments from inner crossing to unit circle
Source:R/circular_plotting.R
add_heading_vectors.RdDraws a segment from the inner-radius crossing position to the heading endpoint on the unit circle for each row of a headings data frame. This visualises the extrapolated vector used to derive the heading and mirrors the dotted-line display in the original millipede tracking workflow.
Usage
add_heading_vectors(
  headings_df,
  colour_col = NULL,
  colour = NULL,
  linetype = "dotted",
  axial = FALSE,
  color_col = NULL,
  color = NULL
)
Arguments
- headings_df
Data frame with columns `heading` (radians), `x_inner`, and `y_inner`.
- colour_col, color_col
Name of a column in `headings_df` to map to the colour aesthetic. When `NULL` (default), the value of `attr(headings_df, "colour_col")` is used if set – so vectors automatically inherit the colour mapping from the associated trajectory plot when that attribute is present. Ignored when `colour` is supplied. `color_col` is the American-spelling alias.
- colour, color
Fixed colour string. Overrides `colour_col` when supplied; when `NULL` and no `colour_col` resolves, defaults to `"black"`. `color` is the American-spelling alias.
- linetype
Line type string or integer passed to `geom_segment`.
- axial
Logical; when `TRUE`, draw each vector at both `heading` and `heading + pi`, with the inner start point reflected through the origin. Default `FALSE`.
Details
Requires columns `heading`, `x_inner`, and `y_inner`, which are present when [derive_headings()] is called with `rule = "crossing"` and `return_coords = TRUE`.
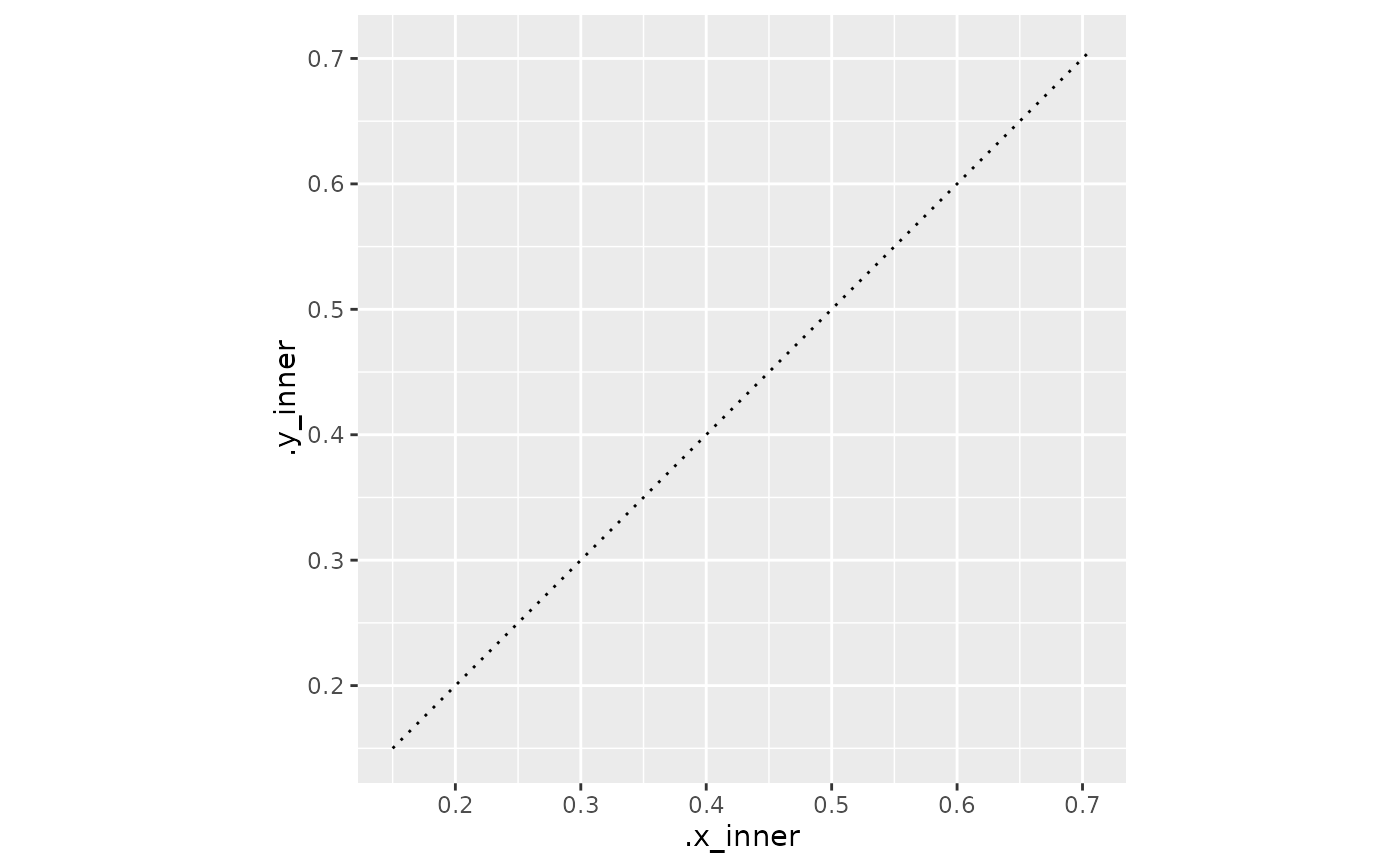
Examples
library(ggplot2)
hd <- data.frame(id = "A", time = 1, heading = pi / 4,
                 x_inner = 0.15, y_inner = 0.15)
ggplot() + coord_fixed() + add_heading_vectors(hd)