Compute a circular density and add it to a radial plot in one step
Source:R/circular_plotting.R
add_heading_density.RdConvenience wrapper that calls [compute_circular_density()] followed by [add_circular_density()]. Equivalent to: “`r add_circular_density( compute_circular_density(headings_df, heading_col, colour_col, method, ...), colour_col = colour_col, scale = scale, ... ) “`
Usage
add_heading_density(
  headings_df,
  heading_col = "heading",
  colour_col = NULL,
  method = c("vonmises", "kernel", "histogram"),
  n_theta = 500L,
  bins = 36L,
  bw = NULL,
  boot_reps = 0L,
  boot_alpha = 0.05,
  scale = 0.4,
  colour = "black",
  fill = NA,
  alpha = 0.2,
  linewidth = 0.8,
  ci_fill = "grey70",
  ci_alpha = 0.3,
  axial = FALSE,
  color_col = NULL,
  color = NULL
)
Arguments
- headings_df
Data frame containing heading angles.
- heading_col
Name of the heading column (radians). Default `"heading"`.
- colour_col, color_col
Optional grouping column. When set, one density is computed per group and the column is included in the output. `color_col` is the American-spelling alias.
- method
Estimation method: `"vonmises"` (default), `"kernel"`, or `"histogram"`.
- n_theta
Number of angular evaluation points for smooth methods. Default `500`.
- bins
Number of angular bins for the histogram method. Default `36` (10degrees each).
- bw
Bandwidth passed to [circular::density.circular()]. `NULL` uses [circular::bw.nrd.circular()].
- boot_reps
Integer. Number of bootstrap replicates for a `"vonmises"` confidence band. `0` (default) skips the bootstrap. Ignored for `"kernel"` and `"histogram"`.
- boot_alpha
Significance level for the bootstrap band. Default `0.05` produces a 95% interval.
- scale
Maximum radial extension above the unit circle. Default `0.4` (peak at r = 1.4). Density is normalised within each group before scaling.
- colour, color
Fixed line colour used when `colour_col` is `NULL`. Default `"black"`. `color` is the American-spelling alias.
- fill
Colour for the region between the unit circle and the density curve. `NA` (default) draws no fill.
- alpha
Alpha transparency for the filled polygon. Default `0.2`.
- linewidth
Width of the density path. Default `0.8`.
- ci_fill
Fill colour for the bootstrap confidence band. Only used when `density_df` contains `density_lower` and `density_upper` columns (produced by [compute_circular_density()] with `boot_reps > 0`, or supplied manually). Default `"grey70"`.
- ci_alpha
Alpha transparency for the confidence band polygon. Default `0.3`.
- axial
Logical; when `TRUE`, mirror each observation to `heading_col + pi` before density estimation, producing a period-pi (bidirectional/axial) density. Default `FALSE`.
Details
Use [compute_circular_density()] + [add_circular_density()] directly when you need to inspect or replace the density values before plotting (e.g. to substitute a Bayesian posterior predictive density from `brms`).
Examples
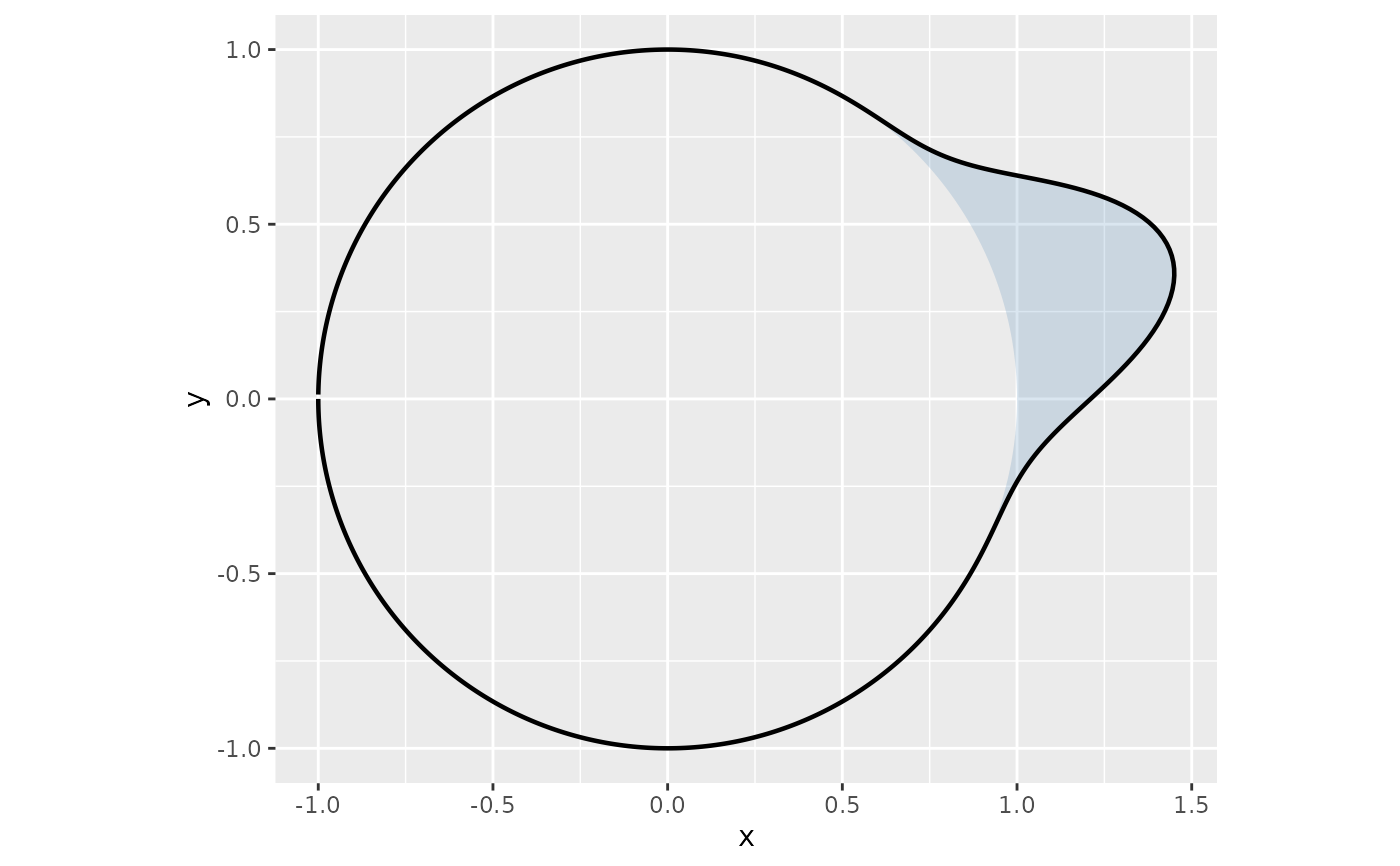
library(ggplot2)
hd <- data.frame(heading = c(0.2, 0.3, 0.4, 0.5, -0.1, 0.1, 0.6, 0.2))
ggplot() + coord_fixed() + add_heading_density(hd, fill = "steelblue", scale = 0.5)